A Historical Analysis of the Top 10 Companies: Trends, Patterns and Performance
The goal of this project is to analyze the performance and trading patterns of the top 10 companies to identify investment opportunities, understand market dynamics, and inform strategic decision-making for portfolio management.
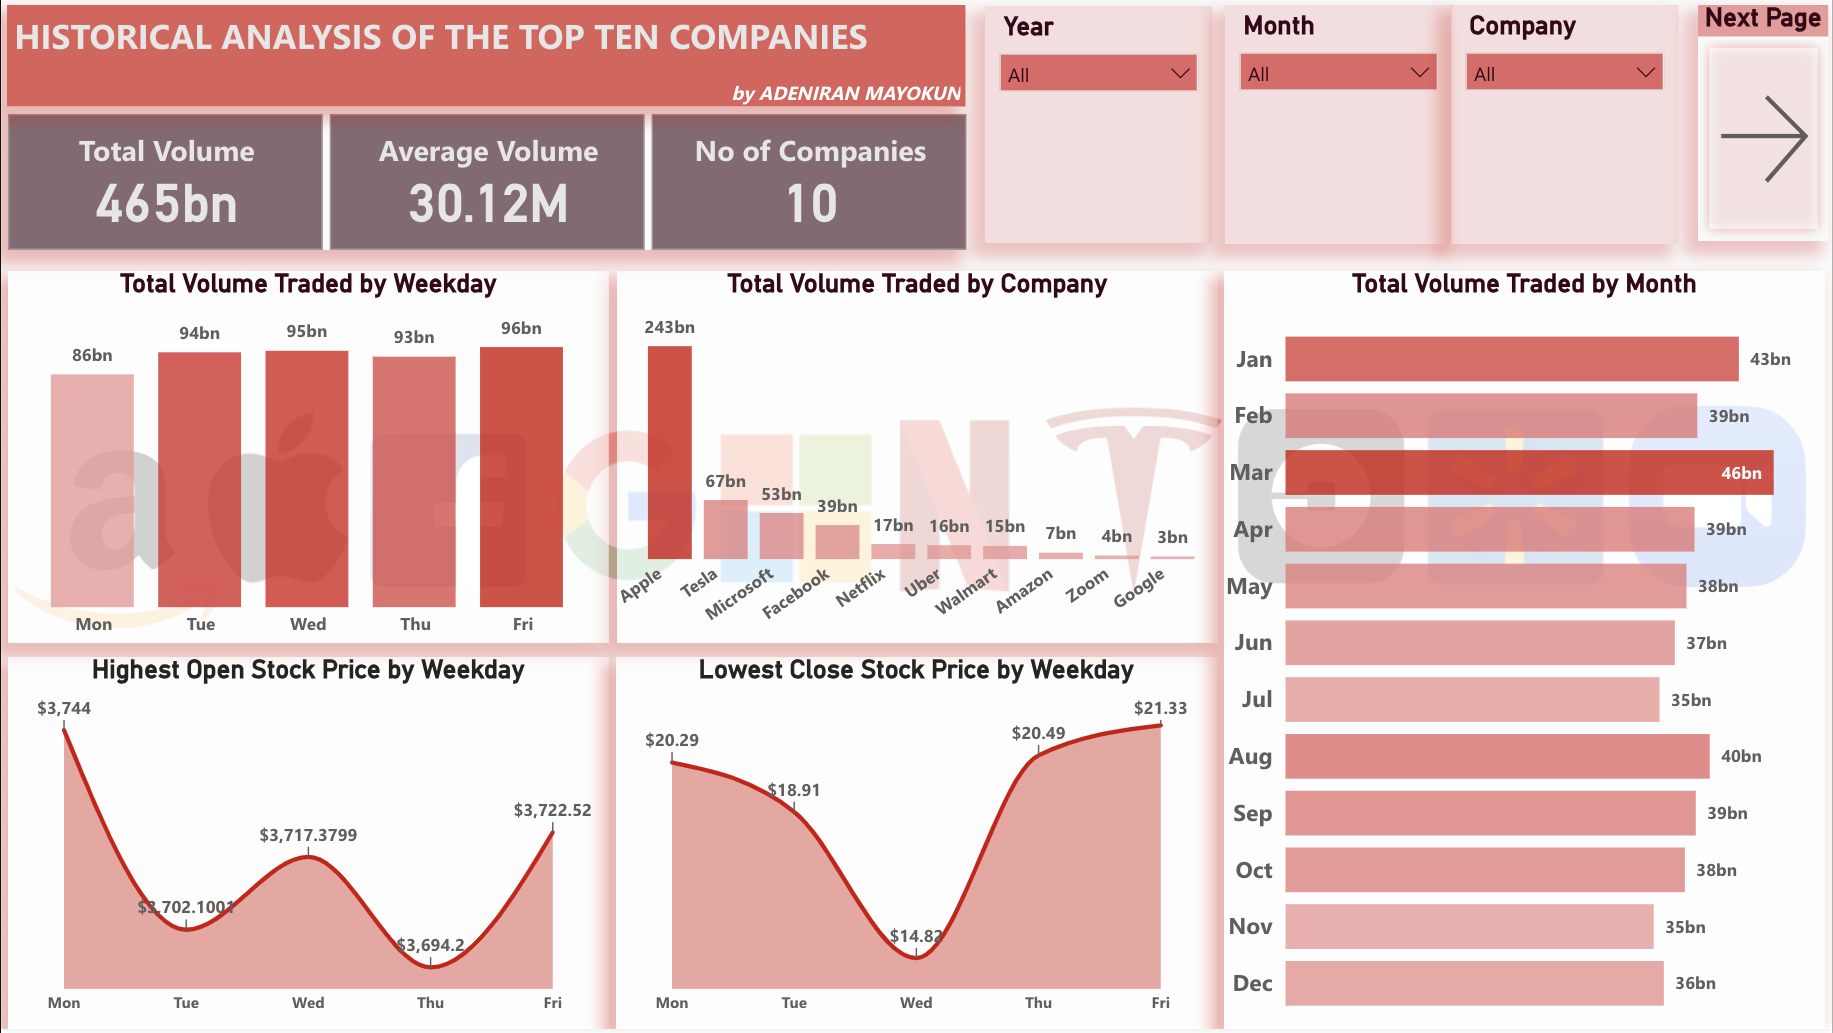
Key Insights:
✪ The total trading volume of the top 10 companies is substantial at 465bn, with an average volume of 30.12m per company.
✪ The companies with the highest stock prices are Amazon, Google, Netflix, Tesla, and Facebook, indicating their strong market performance.
✪ Amazon, Google, and Facebook have the highest average adjusted close prices, suggesting they are the top-performing companies in the group.
✪ The stock prices and trading volumes show significant variations across different weekdays and months, highlighting the dynamic nature of the market.
Recommendations:
✪ Closely monitor the performance and trading patterns of the top-performing companies, such as Amazon, Google, and Facebook, to identify potential investment opportunities.
✪ Analyze the factors driving the stock price and trading volume fluctuations across weekdays and months to optimize investment strategies and timing.
✪ Investigate the reasons behind the stock price differences between the top 5 companies by stock price and the top 5 companies by average adjusted close, as this could reveal insights into investor sentiment and market dynamics.
✪ Consider diversifying the portfolio to include a mix of high-performing and more stable companies to balance risk and potential returns.
To learn more about this project, click the view report button.